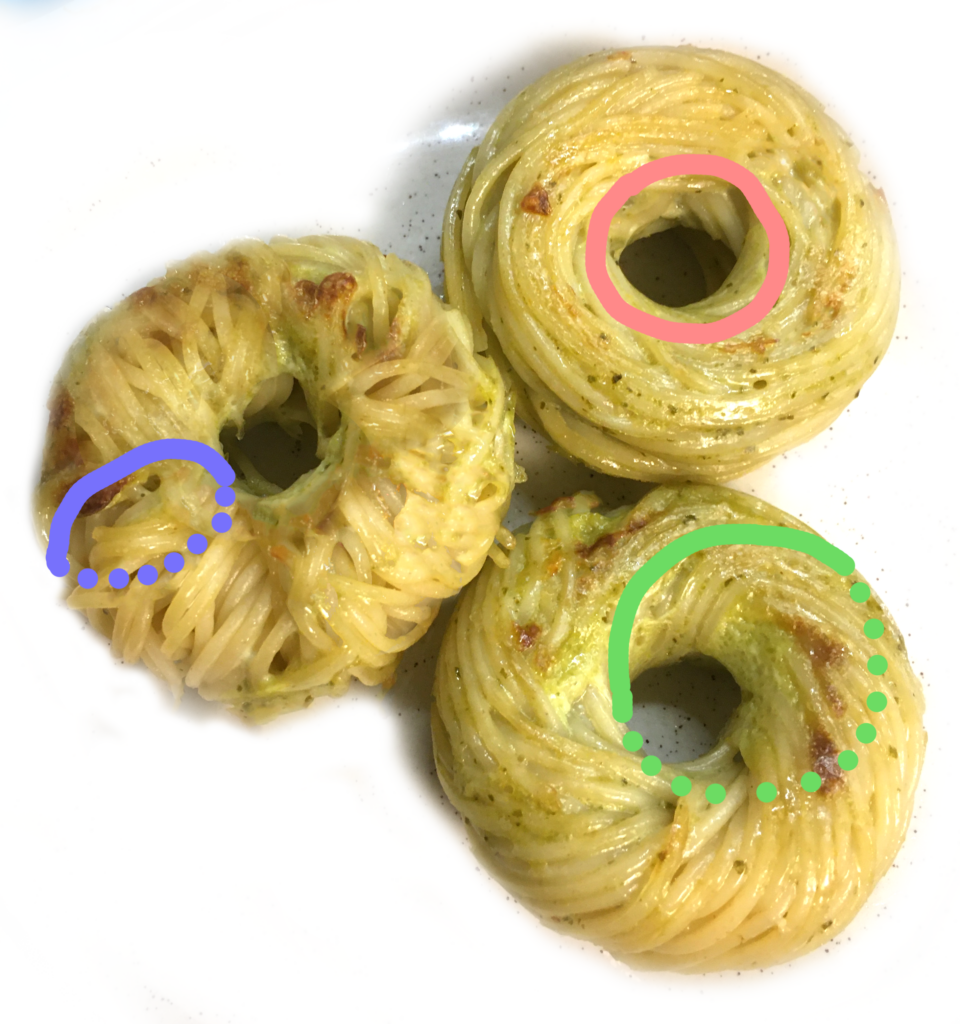
Par 1 point du tore, il passe 4 cercles.
Comme l’illustrent ces gratins de spaghettis toriques, par un point du tore, il passe 2 cercles, un ‘horizontal’ en rose et un ‘vertical’ en bleu, et deux cercles de Villarceau en vert et son symétrique.

On peut aussi obtenir une courbe en forme de 8

Asymptote:

Autre exemple:

Avec Asymptote:
\begin{asy}
settings.render = 8;
settings.prc = false;
import graph3;
import contour;
size3(8cm);
currentprojection = orthographic(10,1,4);
defaultrender = render(merge = true);
// create torus as surface of rotation
int umax = 40;
int vmax = 40;
surface torus = surface(Circle(c=2Y, r=0.6, normal=X, n=vmax), c=O, axis=Z, n=umax);
torus.ucyclic(true);
torus.vcyclic(true);
pen meshpen = 0.3pt + gray;
draw(torus, surfacepen=material(diffusepen=white+opacity(0.6), emissivepen=white));
for (int u = 0; u < umax; ++u)
draw(torus.uequals(u), p=meshpen);
for (int v = 0; v < vmax; ++v)
draw(graph(new triple(real u) {return torus.point(u,v); }, 0, umax, operator ..),
p=meshpen);
pair a = (floor(umax/2) + 2, 3);
dot(torus.point(a.x, a.y), L=" ", align=W);
pair b = (5, floor(vmax/2));
dot(torus.point(b.x, b.y), L="
 ", align=2Z + X);
path3 abpath(int ucycles, int vcycles) {
pair bshift = (ucycles*umax, vcycles*vmax);
triple f(real t) {
pair uv = (1-t)*a + t*(b+bshift);
return torus.point(uv.x, uv.y);
}
return graph(f, 0, 1, operator ..);
}
real linewidth = 0.8pt;
draw(abpath(0,0), p=linewidth + orange);
draw(abpath(1,0), p=linewidth + red);
draw(abpath(1,-1), p=linewidth + darkgreen);
\end{asy}
", align=2Z + X);
path3 abpath(int ucycles, int vcycles) {
pair bshift = (ucycles*umax, vcycles*vmax);
triple f(real t) {
pair uv = (1-t)*a + t*(b+bshift);
return torus.point(uv.x, uv.y);
}
return graph(f, 0, 1, operator ..);
}
real linewidth = 0.8pt;
draw(abpath(0,0), p=linewidth + orange);
draw(abpath(1,0), p=linewidth + red);
draw(abpath(1,-1), p=linewidth + darkgreen);
\end{asy}Dessiner tore et geodesic en latex:
https://tex.stackexchange.com/questions/70090/3d-helix-torus-with-hidden-lines?rq=1
Cercles de Villarceau
![Rendered by QuickLaTeX.com \begin{texgraph}[name=villarceau, file] Graph image = [ view(-6,6,-5,5),Marges(0,0,0,0),size(7.5), R:=3, r:=1, N:=rot3d(vecK,[Origin,vecI],arcsin(r/R)), view3D(-5,5,-5,5,-5,5), background(full,lightgray), Build3D( bdPlan([Origin, -N], [color:=seagreen, opacity:=0.8]), bdTorus( Origin, R, r, vecK, [color:=steelblue, smooth:=1]), view3D(-5.5,5.5,-5.5,5.5,-5,5), bdAxes( Origin, [arrows:=1, newxlegend("x"),newylegend("y"), newzlegend("z")]), bdCercle(M(r,0,0),R,N,[color:=red, tube:=1]), bdCercle(M(-r,0,0),R,N,[color:=red, tube:=1]) ), Display3D() ]; \end{texgraph}](https://eva.louis-le-grand.net/maths/wp-content/ql-cache/quicklatex.com-90a1f3ccd2f370c95bf93264fbeb6994_l3.png)
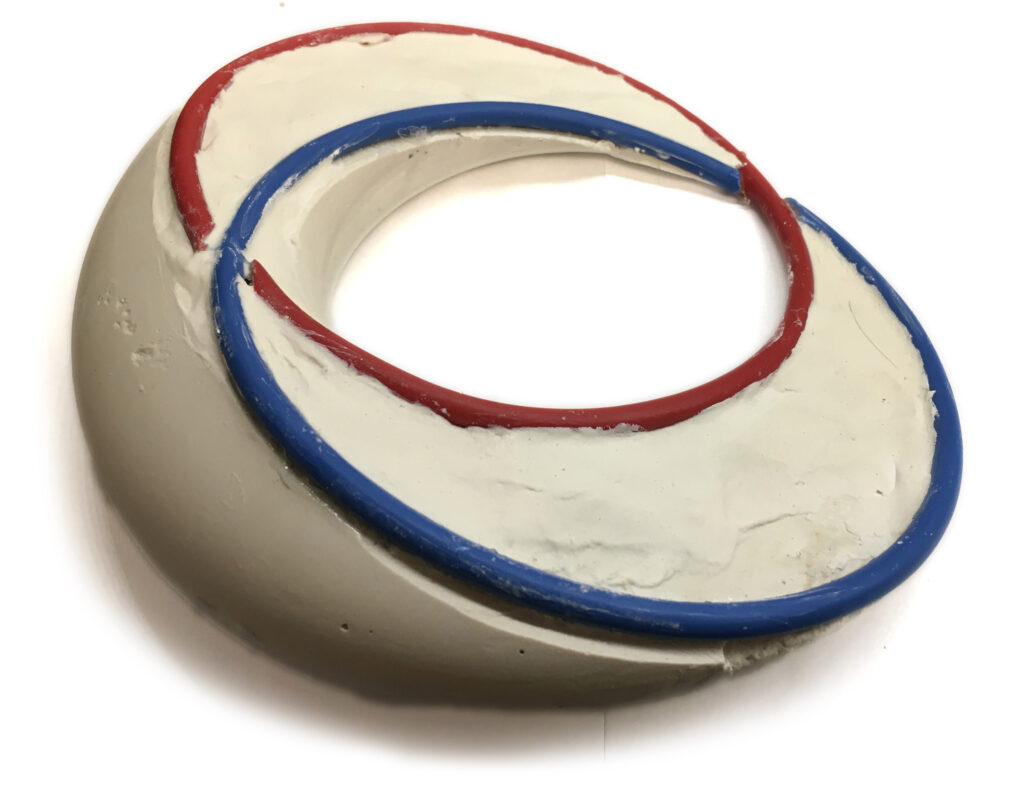
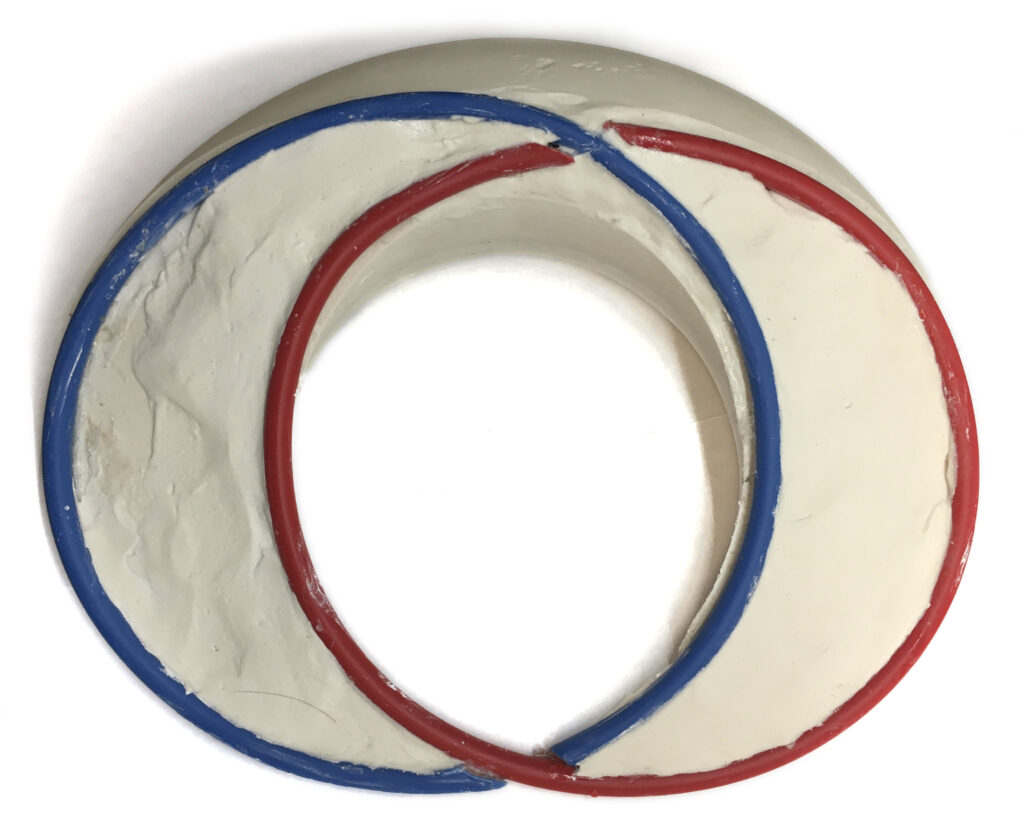
Les cercles en bleu et rouge sur un petit modèle en plâtre.


Démonstration
Il y a deux moyens de montrer l’existence des cercles de Villarceau une fois bien appréhendés par le gâteau.
Soit avec des équations paramétriques.
Soit avec la géométrie projective en 4 dimensions.
Equations paramétriques
…
Géométrie projective en 4 dimensions.
…
